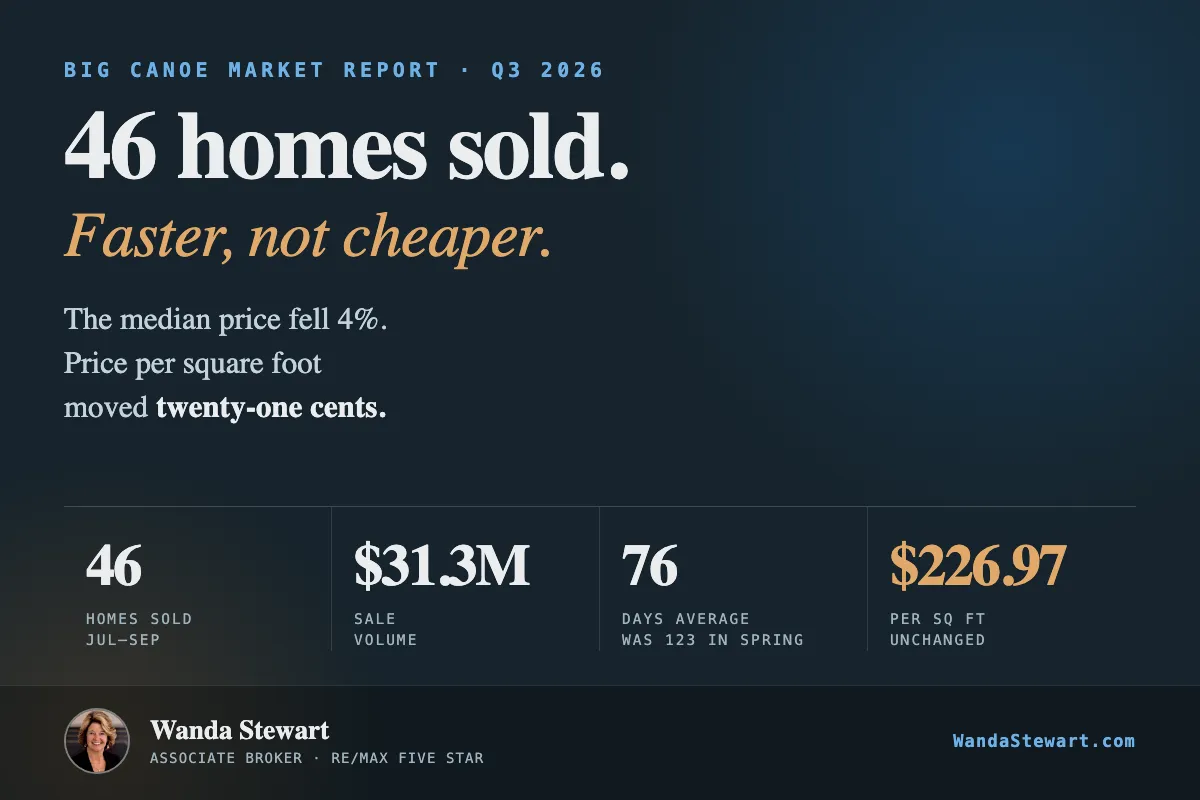
Big Canoe Market Report Q3 2026: Faster, Not Cheaper
Big Canoe Market Report
Third Quarter 2026 · Updated October 21, 2026
If you only see one number about the Big Canoe market this quarter, it's probably this one: the median sale price fell from $645,000 to $619,000. That's about 4%, and it sounds like the beginning of a decline.
It isn't. Here's the number that explains why.
The median price per square foot in Big Canoe was $226.77 in the second quarter and $226.97 in the third. A difference of about twenty cents.
Prices didn't fall. The mix changed — more homes sold at the lower end and fewer at the top. The same house, sold this quarter instead of last, would have brought essentially the same money.
What sold
Forty-six detached homes closed inside the gates between July 1 and September 30, totaling $31,321,600— five more sales than the second quarter, on virtually identical volume.
Q2 (Apr–Jun) | Q3 (Jul–Sep) | |
|---|---|---|
Closings | 41 | 46 |
Sale volume | $31,135,800 | $31,321,600 |
Median sale price | $645,000 | $619,000 |
Median price per sq ft | $226.77 | $226.97 |
Median days on market | 59 | 50 |
Average days on market | 123 | 76 |
The real story is speed
The average Big Canoe home took 123 days to sell in the spring and 76 days in the summer— a 38% improvement, and the clearest signal in this quarter's data. The median moved too, from 59 days to just over 50.
That reflects the long tail of stale listings finally clearing. Homes that had been sitting since winter found buyers, and the market left behind is moving at a healthier pace.
The trend runs in one direction. Sales have climbed from 26 in the first quarter to 41 in the second and 46 in the third, and the average home now sells in 76 days rather than 138.
September on its own
September closed 16 homes for $11,129,500, with a median sale price of $596,000. The month's largest sale was 150 Summit Drive at $1,525,000.
Homes sold at a median 94.1% of their original asking price in 58 days— the softest month of the quarter on both measures, which is normal as the summer buying season tapers. Three of the month's sales fell in the $500,000–$599,999 band, the first real movement that band had seen since spring.
What two quarters say about pricing
This is the pattern I watch most closely, because it costs sellers real money. Sort every sale by one question —did this seller ever reduce the asking price?— and the answer has held across both quarters:
Sold for (% of original ask) | Median days | |
|---|---|---|
Q3 — never reduced(29 sales) | 96.8% | 37 |
Q3 — reduced at least once (17 sales) | 91.2% | 113 |
Q2 — never reduced (29 sales) | 97.6% | 30 |
Q2 — reduced at least once (12 sales) | 86.9% | 174.5 |
Homes priced correctly from day one sold for roughly 97% of their original asking price in about a month. Homes that needed a reduction sold for 87–91%, after three to six months.
There's an encouraging wrinkle. More sellers reduced this quarter — 37%, up from 29% — but they did it sooner, and it showed: the typical reduced home sold about 62 days faster than its spring counterpart and kept 4.3 percentage points more of its original price.
A cut made at week six costs far less than the same cut made at week twenty. This quarter's sellers proved it.
Where the market is tight, and where it isn't
Big Canoe is not one market. It's several, and they behave very differently.
Price band | Q3 sales | Active now | Months of supply |
|---|---|---|---|
Under $400K | 3 | 14 | 14.0 |
$400–499K | 11 | 18 | 4.9 |
$500–599K | 6 | 24 | 12.0 |
$600–699K | 8 | 13 | 4.9 |
$700–799K | 7 | 16 | 6.9 |
$800–899K | 3 | 12 | 12.0 |
$900–999K | 4 | 7 | 5.2 |
$1.0–1.49M | 2 | 11 | 16.5 |
$1.5M+ | 2 | 10 | 15.0 |
Two bands are genuinely tight — $400,000–$499,999 and $600,000–$699,999 both sit under five months of supply, a seller’s market by any conventional measure. What’s striking is what sits between them: the $500s, at twelve months. Above $1 million, supply runs past fifteen months.
The $500s remain the community's problem. Twenty-four homes are listed there — the largest single block of inventory in Big Canoe — and eighteen have already reduced.
Where the buyers actually are
I track showings as well as sales, because sale records tell you what closed and showing records tell you what buyers considered. ShowingTime logged 545 appointments across Big Canoe in the third quarter, on 91 listings.
They are nowhere near evenly spread. Seven homes priced between $900,000 and $999,999 drew 107 showings— about one in five of all buyer traffic in the community, on roughly 6% of its inventory. One $50,000 slice, $950,000–$999,999, took 78 showings across five listings.
Meanwhile six stretches of the price ladder drew zero showings across all 92 days— including everything between $600,000 and $649,999, and everything from $1.6 million to $1.9 million.
What this means heading into winter
If you're thinking of selling: two quarters of data say the same thing — the first price is the one that matters. If your home has been listed since summer without an offer, a decision made in October will cost far less than the same decision made in February.
If you're buying: there are 125 active listings today and half have already reduced — $3,083,900 shaved off the community's combined asking price. The $500s and the $1 million-plus bands hold the most negotiable inventory. Between $400,000 and $700,000, and again around $900,000, well-priced homes still move quickly.
Previous quarters
Q1 2026 (Jan–Mar): 26 sales · $15,535,150 · median $526,250 · 92.5% of original · 138 days average
Q2 2026 (Apr–Jun): 41 sales · $31,135,800 · median $645,000 · 96.4% of original · 123 days average
Q3 2026 (Jul–Sep): 46 sales · $31,321,600 · median $619,000 · 95.7% of original · 76 days average
How I produce these numbers
All figures come from First Multiple Listing Service (FMLS), filtered to Residential Detached properties in the Big Canoe subdivision, zip 30143. Closed sales cover 04/01/2026–09/30/2026; active inventory is as of October 19, 2026. "Share of original" is the sale price divided by the original list price, not the final one. Days on market is FMLS Total DOM. Showing counts come from ShowingTime Target Market Analysis reports for the City of Big Canoe.
One note on timing: closings are entered into the MLS days or weeks after they happen, so a quarter measured too soon after it ends undercounts. Second-quarter figures here are settled; third-quarter figures may rise slightly as late entries arrive.
This page is updated every quarter.If you'd like the detail behind any number — including the full list of all 46 sales — just ask. I'm glad to send it.
Curious what your home is worth?
I will look at what similar Big Canoe homes have actually sold for and give you a straight answer.
👉 → Get Your Home Value Report
Or call or text me at 706-299-9515.
Whether you are ready to make a move or just want to understand the market, I am happy to talk. There is no pressure and no obligation. After all, there is no place like home.
Wanda Stewart
Associate Broker, RE/MAX Five Star
Source: FMLS (First Multiple Listing Service), Big Canoe, zip 30143, residential detached. Sold figures are for July 1 – September 30, 2026. Active listings are as of October 19, 2026. Information is deemed reliable but not guaranteed. This is not an appraisal or a prediction of future market performance.


